The Mapmaker’s View of a Countryside
Read a countryside map with care: learn how its symbols, scale and omissions guide you towards the ground without pretending to reproduce it.
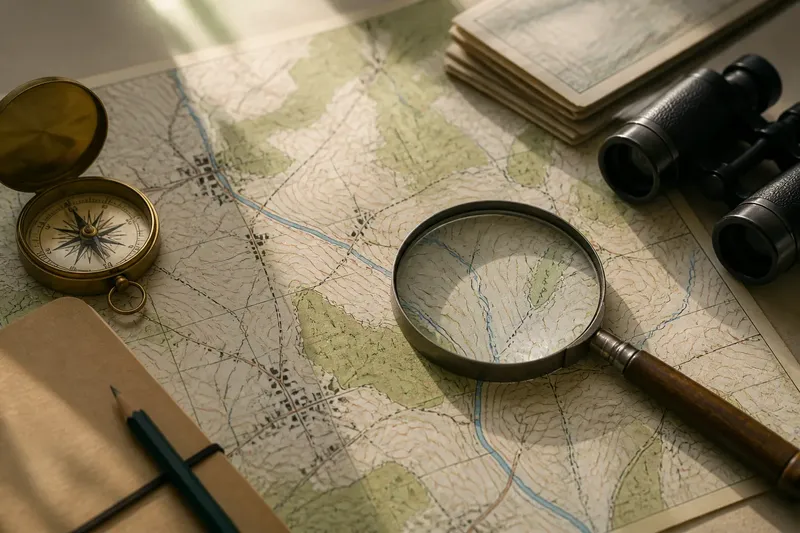
A countryside map is an argument about what matters on the ground. Its symbols and lines help you find a village, stream or field edge, but they also simplify, select and sometimes leave things out. To read a map well, follow the choices that shaped it: start with its purpose, then examine its signs, scale and silences.
What kind of map are you looking at?
Before interpreting any feature, check what the map was made to do. A road map gives routes visual priority. A land-use map may distinguish pasture from woodland, while a walking map gives more attention to paths, contours and access points. A map made for administration may show boundaries more clearly than the small streams or hollows that shape a walk.
Look for the title, date, publisher and legend. These details establish the map’s intended audience and the conventions it follows. A historic estate plan, for instance, might emphasise ownership and field divisions; a modern public map may foreground roads, settlements and named features. Neither is simply a more complete picture. Each answers a different question.
Mapmaking has long involved choices about how to turn a three-dimensional place into a flat, readable surface. Earlier maps often prioritised routes, property, settlements or distinctive landmarks, with forms and symbols shaped by their makers’ purposes and available techniques. Later surveying and printing conventions made it easier to show terrain and standardise signs, but did not remove interpretation. The cartographer still had to decide what to include, how to classify it and how much detail the page could hold.
How do symbols turn into landscape?
Read the legend before treating a mark as a fact about the land. A thin blue line might indicate a stream, but it may not tell you whether the channel carries water year-round. A dotted line could mean a path, a boundary or another feature, depending on the map’s key. Colours also need context: green may identify woodland on one map and a broader category of vegetation on another.
Compare similar marks rather than interpreting one in isolation. If a map draws some watercourses as solid lines and others as broken ones, the difference may signal a classification chosen by the publisher. It does not, by itself, explain why a particular stream looks one way or whether it will be visible on the ground.
Imagine you are checking a map before walking to a small wooded valley. The legend shows a blue line and a green patch, while a nearby track is marked with dashes. You can use those signs to form a plan: expect a watercourse, woodland and a route in the vicinity. You should still treat the symbols as prompts to observe, not as promises that the stream is flowing or the track is open and easy to follow.
What does scale let you see?
Scale describes the relationship between a distance on the map and the corresponding distance on the ground. A large-scale map covers a smaller area with more detail; a small-scale map covers a larger area with less. This distinction is easy to misread because “large” refers to the map’s representative fraction, not to the sheet’s physical size.
At a detailed scale, a map may show individual buildings, minor tracks and narrow watercourses. At a broader scale, those features can disappear, merge or be shifted slightly so that the map remains legible. A cluster of buildings may become a single symbol. A winding stream may be simplified into a smoother line.
Keep the intended use in mind. A regional map can help you understand how settlements relate to hills and valleys, but it may not support close decisions about a field gate or footpath junction. Conversely, a detailed sheet can show local features without making the broader pattern obvious. Check the scale bar and coverage before relying on a map for a particular question.
How can contours and shading describe relief?
Contour lines connect places at the same elevation. Their spacing offers a visual clue to slope: lines close together indicate a steeper rise or fall than lines set farther apart. Contours do not show every bump, bank or shallow hollow. They turn complex ground into a readable pattern, so a small feature may be omitted or smoothed away.
Some maps add hill shading, using light and dark tones to suggest the shape of the land. This can make ridges and valleys easier to recognise, but the shading is an aid to perception, not a photograph. Its apparent direction depends on the assumed light source. Read it alongside the contours and named watercourses rather than treating a dark patch as a physical feature in itself.
Notice how relief relates to other marks. A stream shown in a low area between contour lines may help you understand the valley’s course. A settlement on a flatter contour pattern may sit on gentler ground, though the map alone cannot tell you how firm, wet or exposed the site feels underfoot.
What can a map leave out?
Every map has limits, even when its legend is detailed. A boundary may be omitted to reduce clutter; a narrow footpath may be too small to print clearly; a feature may have changed since the map was made. Some maps also classify a mixed landscape into broad categories, making a patchwork of rough grass, scrub and trees appear uniform.
Read blank space carefully. It may mean that no feature in the map’s chosen categories was recorded there, not that the ground is empty. Likewise, the absence of a marked route is not proof that no track exists, and a line on a map does not settle whether access is permitted. Where access or current conditions matter, consult the relevant local information and follow posted signs and applicable rules.
It is not worth trying to infer a precise field condition from a general map symbol. A mapped meadow cannot tell you whether the grass is cut, and a woodland symbol cannot reveal the density of undergrowth. Use the map to choose what to look for, then let direct observation answer questions the map was not made to settle.
Which map questions do readers often ask?
Why do two maps show the same place differently?
They may have different purposes, scales, dates or symbol systems. Compare their legends and publication details before deciding that one depiction is wrong.
Does a map symbol mean a feature is still there?
Not necessarily. Maps can lag behind changes to land and infrastructure, so a symbol is evidence of what the map represents, not a current inspection.
Can I compare older and newer maps directly?
Yes, but first check that they cover the same area and use compatible scales. Differences may reflect changing conventions or levels of detail as well as real changes on the ground.
Why are some small features missing?
They may fall below the map’s level of detail, be judged less relevant to its purpose or be removed to keep the page clear. Their absence is a limit of representation, not a full description of the place.
How should you carry the map’s view into the countryside?
Use the map to form a question, not to dictate what you must see. If it shows a ridge, look for the changing slope and the way the horizon opens. If it marks woodland beside a stream, check how the trees, drainage and ground meet. These observations help connect the printed categories to the specific landscape in front of you.
Keep the map’s date and purpose in mind as you do so. A map may be excellent for understanding the arrangement of valleys and settlements while offering little guidance about a newly altered path. For current route conditions or access, use appropriate local information rather than relying on an old symbol alone.
The mapmaker’s view remains useful precisely because it is selective. Once you recognise the choices behind its lines, colours and gaps, you can read a countryside map with more care: as a guide to patterns in the land, and an invitation to notice what lies beyond the page.